

A store forecast misses on both sides in the same week. One product stocks out during a local event and another ends the week in markdown. The forecast model gets blamed, but the model was only one part of a decision path that included events, weather, supplier lead time, inventory visibility, labor, and replenishment cadence.
Share: Demand forecasting fails when signals move together. Weather, events, promotions, suppliers, inventory visibility, labor, and replenishment all shape the decision risk. #Causality #RetailAnalytics #Forecasting
Synthetic teaching model
This article uses a synthetic retail model. It is not pricing, legal, financial, operational, compliance, or merchandising advice. The sources below justify why some variables belong in the model. The probabilities are invented so the reasoning path is easy to inspect.
The Operating Problem Is Usually Wider Than The Metric
Forecasting is useful only if the forecast can be acted on. A better prediction still fails if the inventory signal is wrong, the supplier lead time is risky, labor cannot absorb the event spike, or replenishment is too slow. The causal question is about the decision system, not just the forecast error.
Why The Dashboard Can Mislead
The dashboard can mislead if it treats forecast error as the root cause. A forecast can be wrong because the world changed, or the decision can fail because stale inventory and slow replenishment made a reasonable forecast unusable.
Plain-language modeling note
A Bayesian belief network, or BBN, is a graph for asking conditional questions. Each node is a condition, each arrow says one condition informs another, and each probability is explicit. You do not need to know the SDK to read the graph: the SDK code is only there when we need a repeatable action query.
The Question For This Example
This example asks how forecast-decision-risk changes after observing volatile weather, high local-event demand, stale historical data, and poor inventory visibility, and what changes if data freshness, visibility, and replenishment are improved.
The target outcome is ForecastDecisionRisk, which means forecast decision risk in this teaching model.
A Small Model Of The Situation
The model treats forecasting as a store-level operating decision. It leaves out full time-series models, safety-stock math, vendor-specific lead times, perishable details, and true local event calendars.
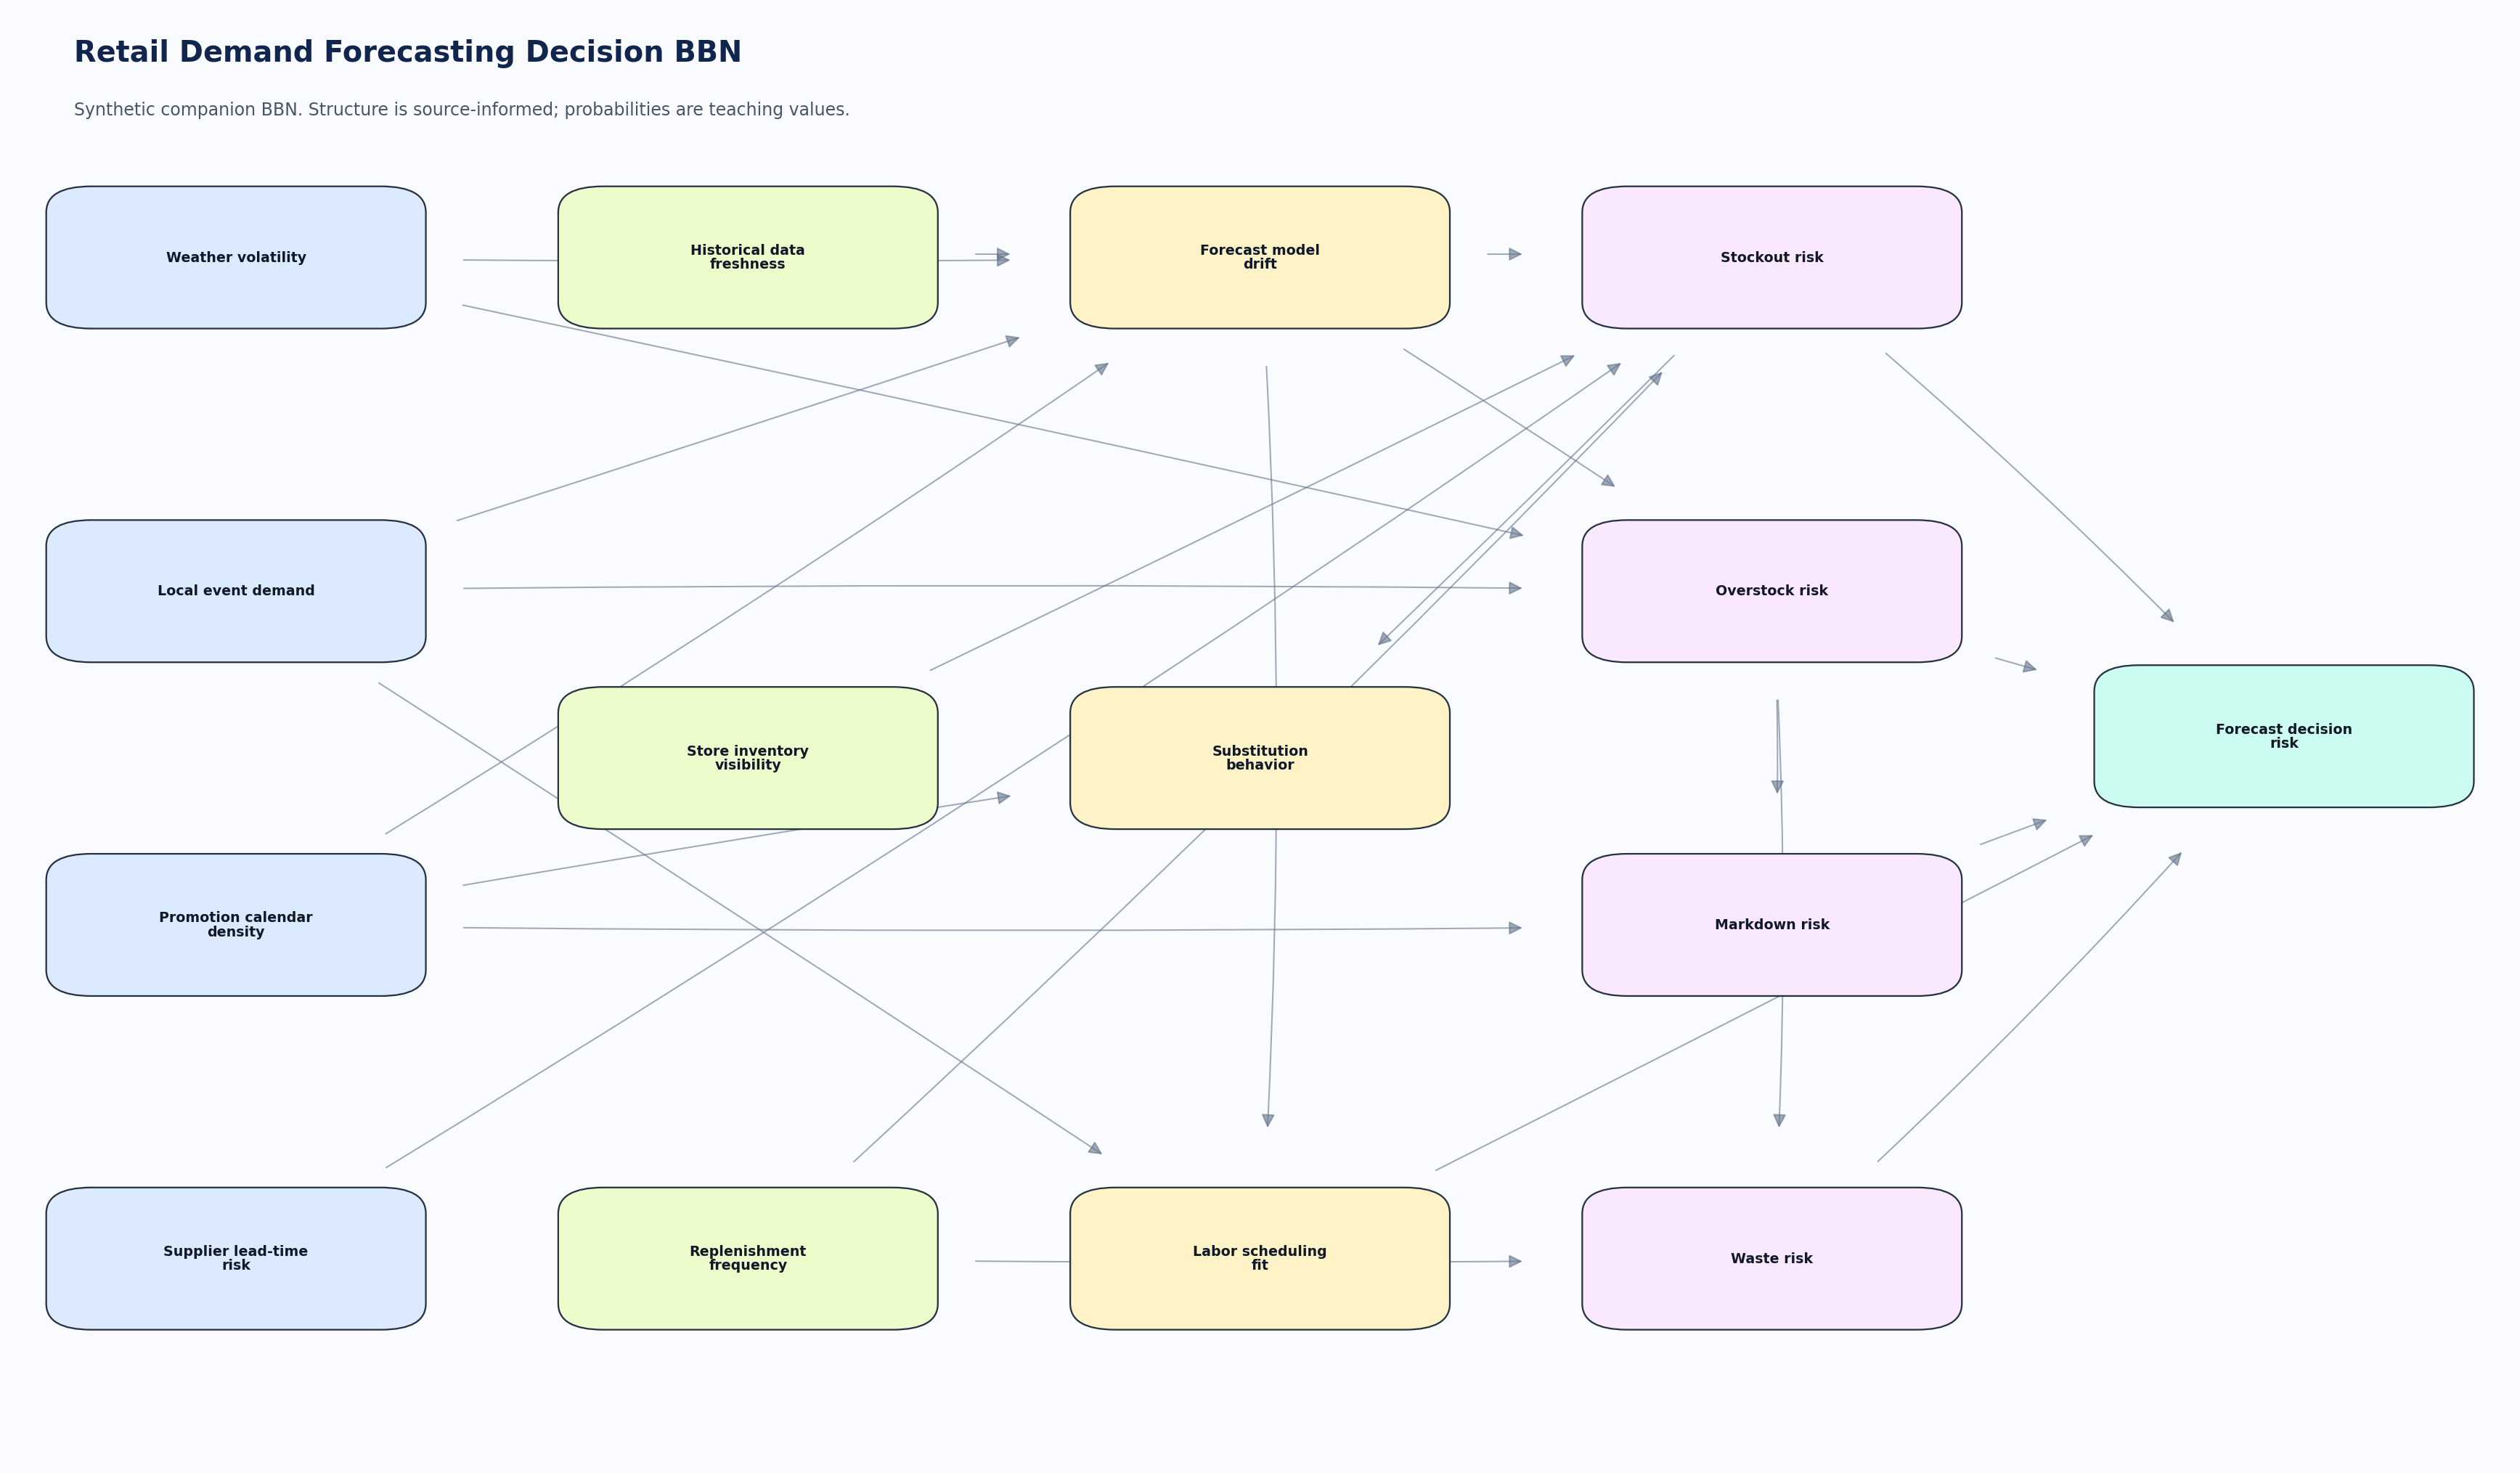
The graph has 15 nodes:
WeatherVolatility: Weather volatility (stable / volatile)LocalEventDemand: Local event demand (low / high)PromotionCalendarDensity: Promotion calendar density (low / high)SupplierLeadTimeRisk: Supplier lead-time risk (low / high)HistoricalDataFreshness: Historical data freshness (fresh / stale)ForecastModelDrift: Forecast model drift (low / high)StoreInventoryVisibility: Store inventory visibility (good / poor)SubstitutionBehavior: Substitution behavior (low / high)LaborSchedulingFit: Labor scheduling fit (good / poor)ReplenishmentFrequency: Replenishment frequency (adequate / low)StockoutRisk: Stockout risk (low / high)OverstockRisk: Overstock risk (low / high)MarkdownRisk: Markdown risk (low / high)WasteRisk: Waste risk (low / high)ForecastDecisionRisk: Forecast decision risk (no / yes)
What Is Sourced And What Is Synthetic
NRF’s supply-chain discussion supports uncertainty, forecasting, inventory planning, goods flow, transparency, and trust. Deloitte’s retail outlook supports inventory visibility, demand forecasting, and omnichannel capabilities. Q2 Deloitte trends support demand, inventory, sourcing, and pricing under supply-chain uncertainty.
Forecasting and inventory planning- NRF’s 2025 supply-chain discussion identifies forecasting, inventory planning, goods flow, network design, transparency, and uncertainty as active concerns.
Inventory visibility- Deloitte’s retail outlook supports including real-time inventory visibility and multiple fulfillment options.
Demand uncertainty- Deloitte’s trend material supports connecting consumer demand, supply-chain stability, inventory, and pricing decisions.
Boundary of the evidence
The sources support the general mechanisms in the graph. They do not estimate this article’s node states, thresholds, or conditional probability values. Those are synthetic teaching values.
The Query The Graph Cannot Show By Itself
The visual graph is the best way to inspect the structure. The code-backed query is there for a narrower reason: we want to separate what is learned by observing a messy retail case from what changes if one condition is set differently.
Using the Darkstar Python SDK, a subscribed SDK user can load the same BBN JSON, ask for the target probability after evidence is entered, then run the action query by setting a node before querying again. The download includes this as illustrative SDK code, while the standalone query_example.py reproduces the article numbers without shipping the SDK.
import json

from darkstar import DiscreteModel

TARGET = "ForecastDecisionRisk"
OBSERVED_EVIDENCE = {
    "WeatherVolatility": "volatile",
    "LocalEventDemand": "high",
    "HistoricalDataFreshness": "stale",
    "StoreInventoryVisibility": "poor"
}
INTERVENTION_CONTEXT = {
    "WeatherVolatility": "volatile",
    "LocalEventDemand": "high"
}
INTERVENTION = {
    "HistoricalDataFreshness": "fresh",
    "StoreInventoryVisibility": "good",
    "ReplenishmentFrequency": "adequate"
}


def probability_after_observing(model, evidence):
    query = {"nodes": [TARGET], "evidence": evidence}
    result = json.loads(model.pquery(json.dumps(query)))
    return result[TARGET]["yes"]


def probability_after_setting(model, setting, evidence):
    changed_model = model.intervene(json.dumps(setting))
    return probability_after_observing(changed_model, evidence)


with DiscreteModel(model_json) as model:
    observed = probability_after_observing(model, OBSERVED_EVIDENCE)
    acted = probability_after_setting(model, INTERVENTION, INTERVENTION_CONTEXT)
That is the article’s main modeling distinction. Observing a pattern is not the same as setting one part of the system differently.
The standalone query code gives this synthetic result:
Baseline forecast decision risk: 25.2%
Observed scenario (volatile local demand with stale data and poor visibility): 36.1%
Action scenario (fresh data, visible inventory, and adequate replenishment): 29.7%
Same context with the action left unfavorable: 39.5%
Synthetic reduction versus the observed scenario: 6.4 percentage points
What We Learn By Observing The Situation
The observed scenario sets:
- Weather volatility = volatile
- Local event demand = high
- Historical data freshness = stale
- Store inventory visibility = poor
The observed scenario raises decision risk because volatile demand signals arrive while data freshness and store inventory visibility are weak. The model treats that as a risky state even before the exact forecast number is known.

What Changes If We Set One Condition Differently
The action scenario sets:
- Historical data freshness = fresh
- Store inventory visibility = good
- Replenishment frequency = adequate
The action query refreshes historical data, improves inventory visibility, and makes replenishment adequate. It does not calm weather or cancel local events. It asks whether the decision path becomes more resilient when the retailer can see and respond faster.
What This Example Cannot Prove
This model cannot forecast demand, choose safety stock, or schedule labor. It is a teaching graph for why forecasting problems are often visibility and actionability problems.
Try this in the shared model
Open the companion model, change one upstream condition at a time, and watch the target probability move. Start with the observed scenario above, then reset one condition that looks actionable. The point is to compare stories, not to treat the toy probabilities as a forecast.
Try The Model
Open the companion Darkstar model: Open Retail Demand Forecasting Decision BBN
In the shared model, keep ForecastModelDrift high but improve StoreInventoryVisibility. Then keep visibility poor and freshen history. The comparison shows why the forecast and the operating response are separate levers.
Download the teaching package: Retail Demand Forecasting Decision BBN ZIP
The ZIP contains synthetic model and examples only. It excludes sales history, event feeds, supplier data, forecasting code, SDK binaries, and chart-generation code.
Leave a Reply