
A pricing team sees costs rise and competitors moving. The model recommends a price increase on a set of products where demand appears resilient. The first-week margin looks better, but customer service hears complaints, competitors adjust, and loyal customers start watching the shelf differently.
Share: Dynamic pricing is not only an elasticity problem. Competitor response, perceived fairness, churn, complaints, and reference price can turn short-term margin into long-term risk. #Causality #RetailAnalytics #PriceOptimization
Synthetic teaching model
This article uses a synthetic retail model. It is not pricing, legal, financial, operational, compliance, or merchandising advice. The sources below justify why some variables belong in the model. The probabilities are invented so the reasoning path is easy to inspect.
The Operating Problem Is Usually Wider Than The Metric
Dynamic pricing is often discussed as a math problem, but retail customers experience it as a fairness and trust problem too. The same price move can raise margin, reduce conversion, reset reference price, trigger churn, or invite scrutiny depending on context.
Why The Dashboard Can Mislead
The dashboard can mislead because short-term margin and long-term response are not the same metric. A price change can be profitable this week and still create reference-price damage, churn, or complaint risk that changes future demand.
Plain-language modeling note
A Bayesian belief network, or BBN, is a graph for asking conditional questions. Each node is a condition, each arrow says one condition informs another, and each probability is explicit. You do not need to know the SDK to read the graph: the SDK code is only there when we need a repeatable action query.
The Question For This Example
This example asks how net-revenue-risk changes after observing uncertain elasticity, competitor movement, a large price change, and low transparency, and what changes if the price move is smaller, more transparent, and supported by better elasticity evidence.
The target outcome is NetRevenueRisk, which means net revenue risk in this teaching model.
A Small Model Of The Situation
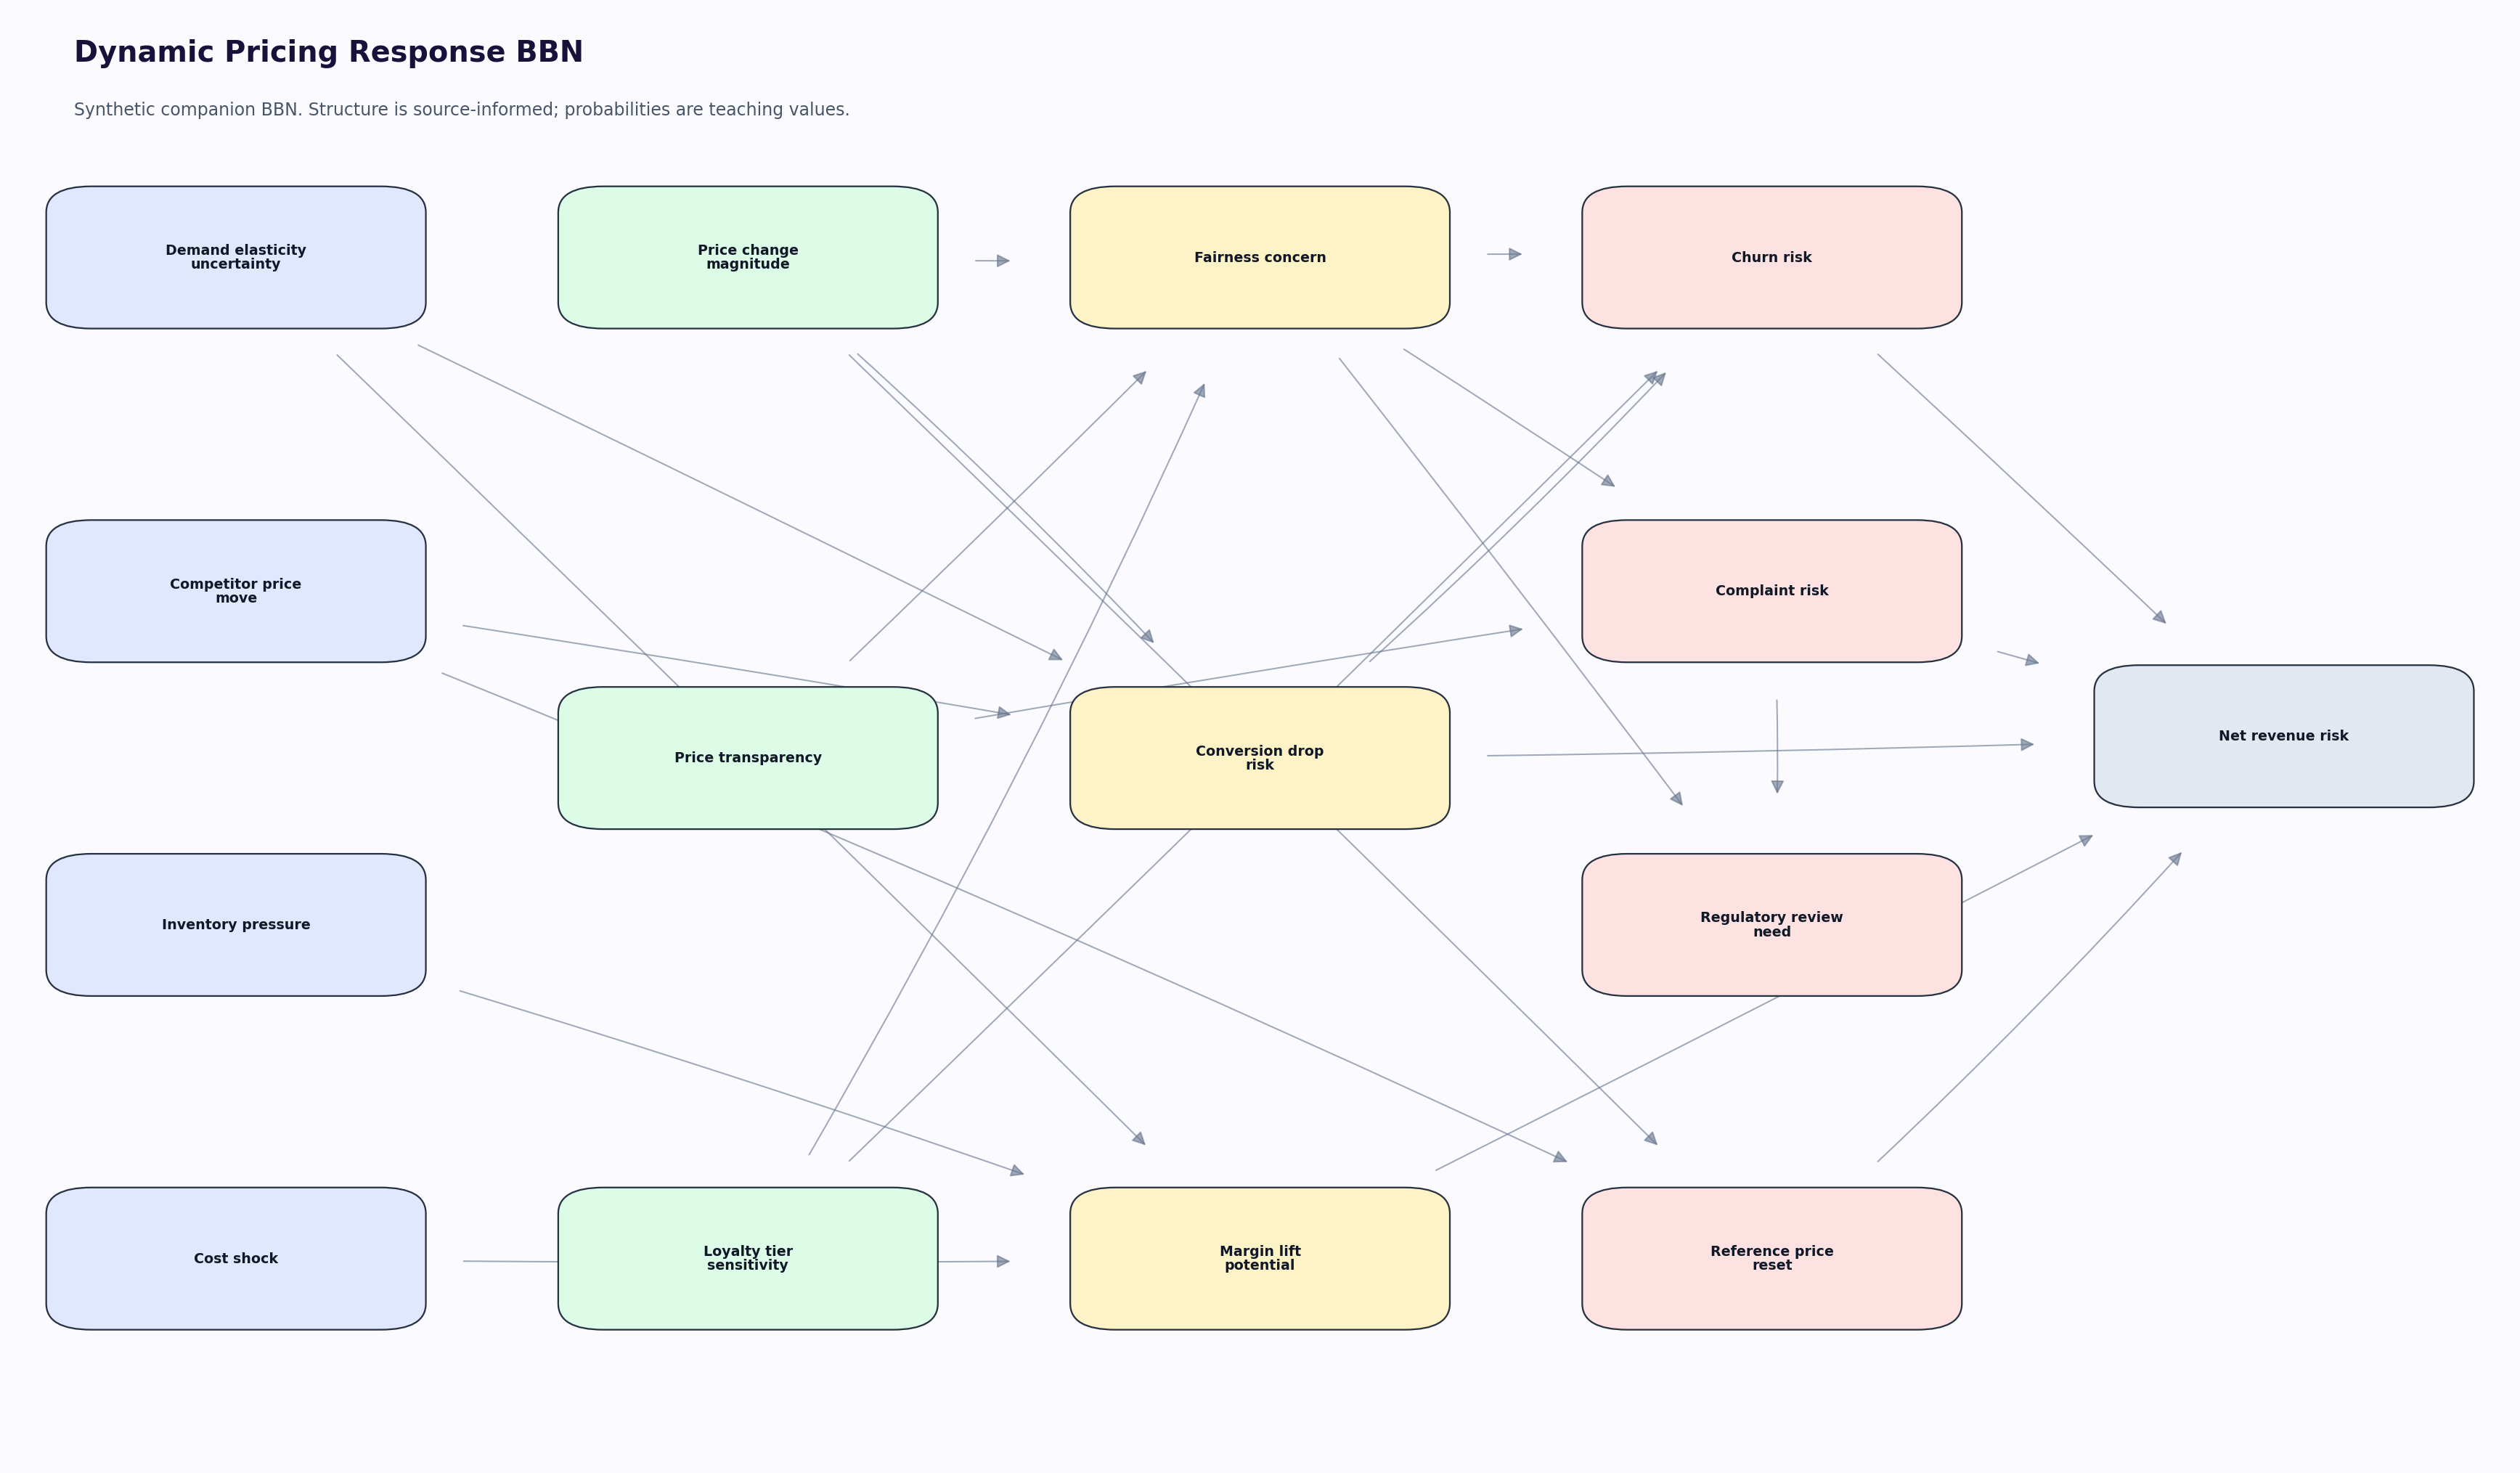
The model treats pricing as a response system with demand, competitors, fairness, churn, and reference-price paths. It leaves out actual elasticities, local laws, personalized pricing policy, promotion calendars, exact cost pass-through, and category strategy.
The graph has 15 nodes:
DemandElasticityUncertainty: Demand elasticity uncertainty (low / high)CompetitorPriceMove: Competitor price move (no / yes)InventoryPressure: Inventory pressure (low / high)CostShock: Cost shock (low / high)PriceChangeMagnitude: Price change magnitude (low / high)PriceTransparency: Price transparency (adequate / low)LoyaltyTierSensitivity: Loyalty tier sensitivity (low / high)FairnessConcern: Fairness concern (low / high)ConversionDropRisk: Conversion drop risk (low / high)MarginLiftPotential: Margin lift potential (adequate / low)ChurnRisk: Churn risk (low / high)ComplaintRisk: Complaint risk (low / high)RegulatoryReviewNeed: Regulatory review need (no / yes)ReferencePriceReset: Reference price reset (no / yes)NetRevenueRisk: Net revenue risk (no / yes)
What Is Sourced And What Is Synthetic
Deloitte’s retail outlook supports dynamic pricing, price-conscious consumers, competition, personalization, and inventory visibility as current priorities. Q2 Deloitte trends support cost, margin, supply-chain, demand, inventory, sourcing, and pricing uncertainty. Personalization sources support customer response and relevance concerns.
Dynamic pricing pressure- Deloitte reports that many retail executives expect AI to assist with dynamic pricing based on demand, competition, and other factors.
Value-seeking consumers- Deloitte frames consumers as price-conscious and value-seeking, which motivates fairness, churn, and conversion nodes.
Personalized response- McKinsey’s personalization work supports including relevance, timing, and customer-response paths rather than treating price as isolated.
Boundary of the evidence
The sources support the general mechanisms in the graph. They do not estimate this article’s node states, thresholds, or conditional probability values. Those are synthetic teaching values.
The Query The Graph Cannot Show By Itself
The visual graph is the best way to inspect the structure. The code-backed query is there for a narrower reason: we want to separate what is learned by observing a messy retail case from what changes if one condition is set differently.
Using the Darkstar Python SDK, a subscribed SDK user can load the same BBN JSON, ask for the target probability after evidence is entered, then run the action query by setting a node before querying again. The download includes this as illustrative SDK code, while the standalone query_example.py reproduces the article numbers without shipping the SDK.
import json

from darkstar import DiscreteModel

TARGET = "NetRevenueRisk"
OBSERVED_EVIDENCE = {
    "DemandElasticityUncertainty": "high",
    "CompetitorPriceMove": "yes",
    "PriceChangeMagnitude": "high",
    "PriceTransparency": "low"
}
INTERVENTION_CONTEXT = {
    "CompetitorPriceMove": "yes"
}
INTERVENTION = {
    "PriceChangeMagnitude": "low",
    "PriceTransparency": "adequate",
    "DemandElasticityUncertainty": "low"
}


def probability_after_observing(model, evidence):
    query = {"nodes": [TARGET], "evidence": evidence}
    result = json.loads(model.pquery(json.dumps(query)))
    return result[TARGET]["yes"]


def probability_after_setting(model, setting, evidence):
    changed_model = model.intervene(json.dumps(setting))
    return probability_after_observing(changed_model, evidence)


with DiscreteModel(model_json) as model:
    observed = probability_after_observing(model, OBSERVED_EVIDENCE)
    acted = probability_after_setting(model, INTERVENTION, INTERVENTION_CONTEXT)
That is the article’s main modeling distinction. Observing a pattern is not the same as setting one part of the system differently.
The standalone query code gives this synthetic result:
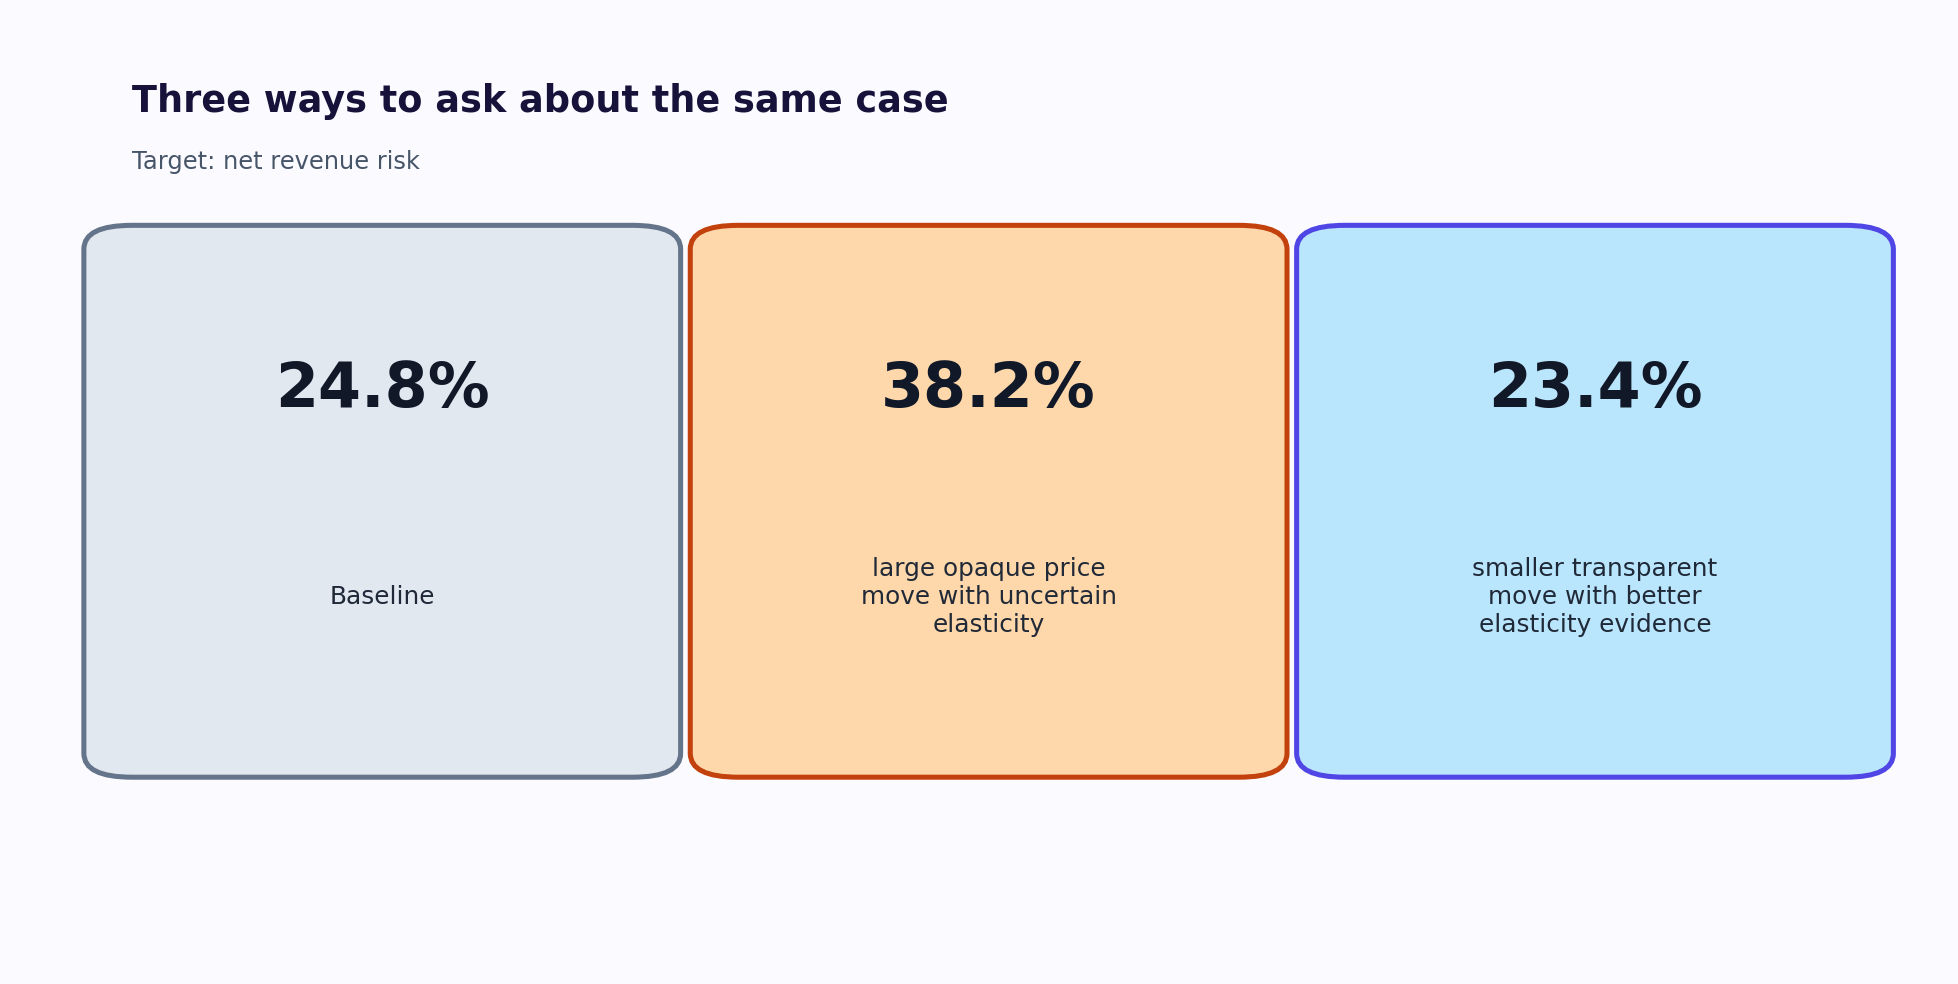
Baseline net revenue risk: 24.8%
Observed scenario (large opaque price move with uncertain elasticity): 38.2%
Action scenario (smaller transparent move with better elasticity evidence): 23.4%
Same context with the action left unfavorable: 38.2%
Synthetic reduction versus the observed scenario: 14.8 percentage points
What We Learn By Observing The Situation
The observed scenario sets:
- Demand elasticity uncertainty = high
- Competitor price move = yes
- Price change magnitude = high
- Price transparency = low
The observed scenario raises net-revenue-risk because the price move is large, opaque, and made under uncertain elasticity while competitors are also moving. The model treats that as a risky basis for declaring victory from margin alone.
What Changes If We Set One Condition Differently
The action scenario sets:
- Price change magnitude = low
- Price transparency = adequate
- Demand elasticity uncertainty = low
The action query sets a smaller price move, improves transparency, and lowers elasticity uncertainty. It does not guarantee higher revenue. It tests whether the risk falls when the pricing decision is less abrupt and better supported.
What This Example Cannot Prove
This model cannot set prices, estimate elasticity, or judge legal compliance. It is a teaching graph for why price optimization should include customer and competitor response paths.
Try this in the shared model
Open the companion model, change one upstream condition at a time, and watch the target probability move. Start with the observed scenario above, then reset one condition that looks actionable. The point is to compare stories, not to treat the toy probabilities as a forecast.
Try The Model
Open the companion Darkstar model: Open Dynamic Pricing Response BBN
In the shared model, keep PriceChangeMagnitude high but improve PriceTransparency. Then lower the magnitude while keeping transparency low. The comparison helps separate fairness concern from price mechanics.
Download the teaching package: Dynamic Pricing Response BBN ZIP
The ZIP contains synthetic model and example code only. It excludes price books, customer segments, elasticities, competitor feeds, legal review materials, SDK binaries, and chart-generation code.
Leave a Reply