
Probabilistic Graphical Models
Probabilistic graphical models for real decisions.
Bayesian networks, Markov networks, causal models, and the inference that runs on them. Worked examples across healthcare, retail, sports, policy, and drug discovery, every one shipping a model you can open and query in Darkstar.
-

Latest
Causality APIs 42: Loyalty Offers And Customer Lifetime Value
A synthetic loyalty-offer model separates redemption from true customer value when identity resolution, prior loyalty, margin, personalization, churn, and reward liability interact.
Latest articles
-

Causality APIs 29: The Marketplace Enrollment That Should Not Have Happened
A synthetic Marketplace integrity model separates improper enrollment risk from consumer confusion, subsidy exposure, notices, agent oversight, and coverage disruption.
-
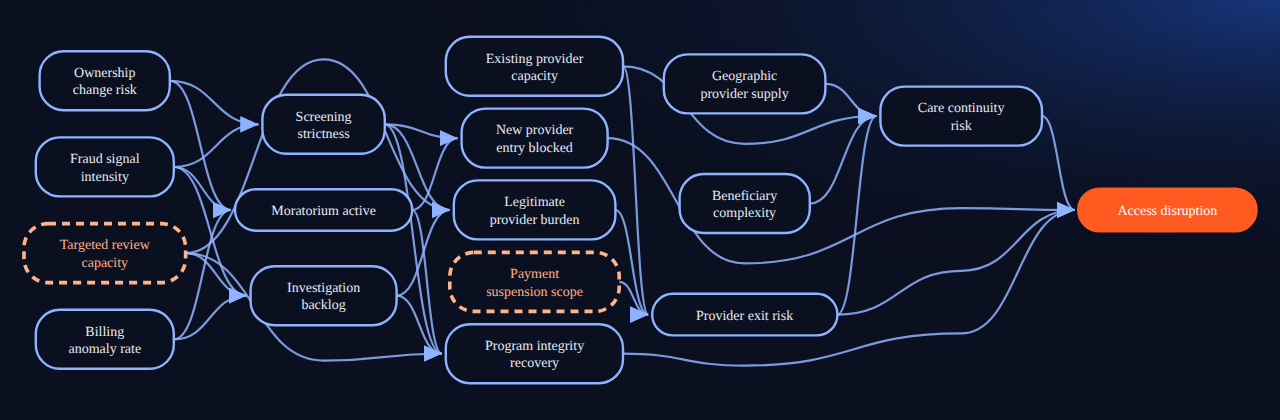
Causality APIs 28: Fraud Controls Have Side Effects
Anti-fraud actions can protect public dollars and still create access pressure when review capacity, payment holds, provider supply, and beneficiary complexity collide.
-

Causality APIs 27: Credentialed, Privileged, Still Waiting
A synthetic credentialing model shows why a clinician can be clinically acceptable and still miss a start date because approvals, documents, EHR access, orientation, and payer enrollment move…
-

Causality APIs 26: When Prior Authorization Becomes An API
Electronic prior authorization can reduce some delays, but the API only helps when criteria, data, attachments, workflow, and payer readiness line up.
-

Causality APIs 25: The Specialty Drug Does Not Start At The Prescription
A synthetic specialty-drug first-fill model separates coverage, documentation, pharmacy access, affordability, and patient-reachability delays.
-

Causality APIs 24: Why Emergency Departments Get Delayed
A crowded emergency department delay can look like a staffing problem, a demand surge, a diagnostic bottleneck, or a boarding problem. A small synthetic BBN separates those explanations.
-
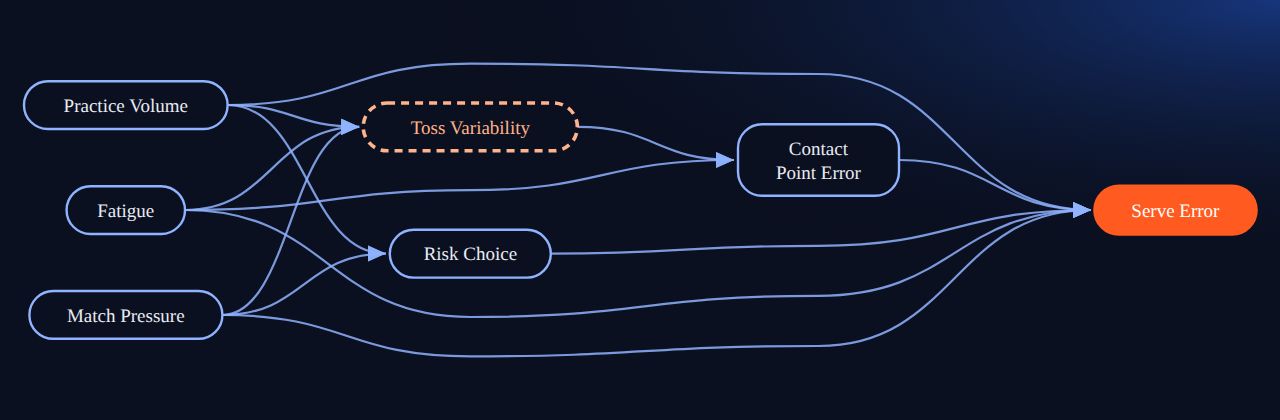
Causality APIs 23: The Serve Broke Down. Or Did The Same Motion Never Exist?
A tennis serve is practiced as a repeatable motion, but match pressure changes toss variability, fatigue, target risk, and contact point. A causal detective story separates those suspects.
-
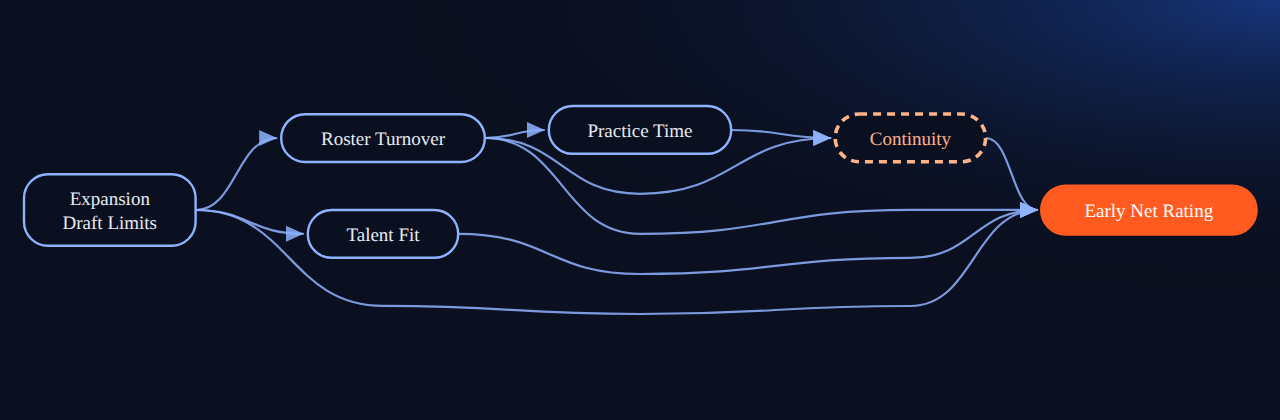
Causality APIs 22: The Expansion Team Started Slow. Was It Talent Or Continuity?
A slow expansion start can reflect talent, continuity, roster construction, or the constraints of the expansion draft. A causal graph keeps those explanations separate.
-
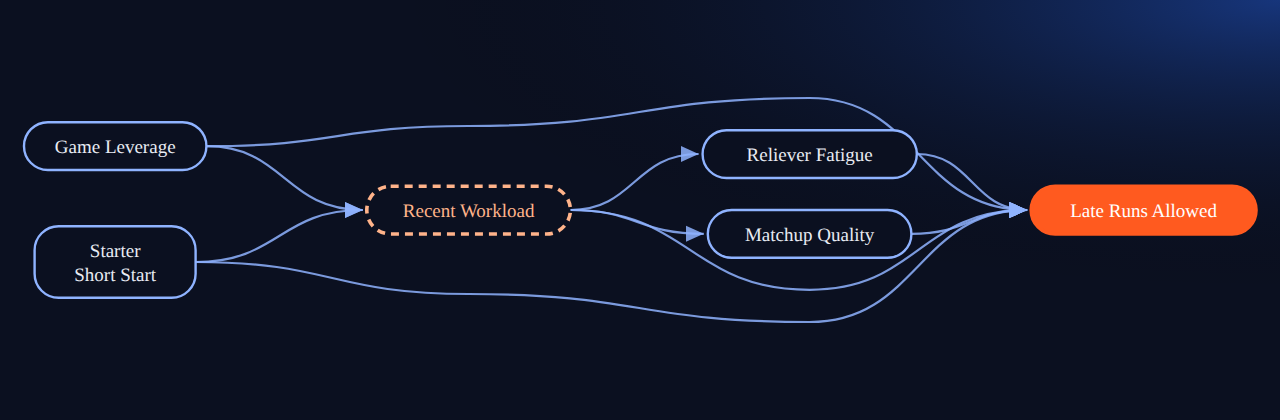
Causality APIs 21: The Bullpen Was Overworked. Did That Cost The Game?
Bullpen fatigue is causal only after separating recent workload from leverage, short starts, matchup quality, and the game state that made managers use the same relievers.
-
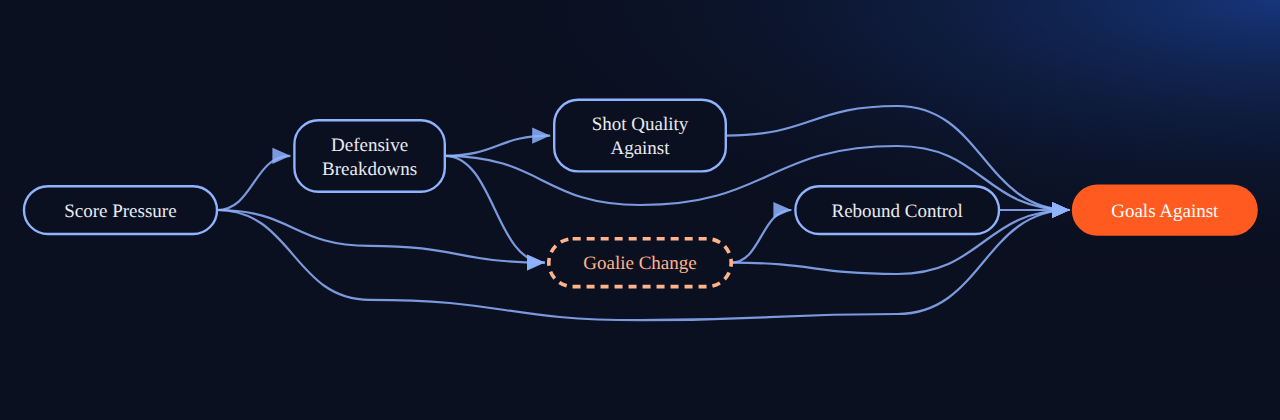
Causality APIs 20: The Goalie Change Saved The Series. Or Did Shot Quality Change?
A goalie change can look like the cause of fewer goals against, but it is often selected by the same defensive breakdowns that change shot quality.
-

Causality APIs 19: The Sweep Bought Rest. Did It Also Buy Rust?
A playoff sweep gives a team extra rest, but the same rest can change recovery, rhythm, scouting, and opponent selection. A causal graph separates rest from the easier…
-

Causality APIs 18: The Artificial Intelligence Coding Tool Raised Productivity. Or Changed What Got Counted?
Artificial intelligence coding tools can raise measured output while changing review load, task selection, and maintained throughput. The causal question is which productivity endpoint moved.